Monitoring SAP health in the Trento Web console
Trento Web combines the individual values of your SAP landscape into one aggregated health value per host, cluster, SAP HANA database and SAP system. You can therefore use the Trento Web console to identify which parts of your SAP landscape need attention.
This document explains what the health values mean, which factors Trento combines to calculate them, how to recognize outdated data, and how to trace a warning or a critical value back to its source.
To access this data, use the left sidebar in the Trento Web console. It contains the following entries:
- Dashboard
-
Identify at a glance which SAP systems need attention, and filter systems by health value.
- Hosts
-
Review all hosts that run the Trento Agent, including, for example, their tuning status, available software updates or check results.
- Clusters
-
Review all discovered Pacemaker clusters, their configuration and their node health.
- SAP Systems
-
Review all discovered SAP systems by system ID, including the status of each instance.
- SAP HANA Databases
-
Review all discovered SAP HANA databases by system ID, including the status of each database instance.
- Checks catalog
-
Browse the configuration checks that Trento can run, by target type (hosts or clusters), cluster type (HANA scale up, HANA scale out or ASCS/ERS) and supported platform (Azure, AWS, GCP, Nutanix, on-premises/KVM or VMware).
- Activity Log
-
Review system events and user actions, with the timestamp, message, user, and severity of each entry.
- Settings
-
Modify user-defined settings, including API keys, the SUSE Multi-Linux Manager connection, Activity Log retention, and email alerts.
- About
-
View the Trento Server component versions, a link to the Trento Web GitHub repository, and the number of discovered SUSE Linux Enterprise Server for SAP applications subscriptions.
Understanding aggregated health in Trento
Every host, cluster, SAP HANA database and SAP system in Trento Web displays one health icon, which represents its aggregated health value. This value is the combination of several factors that Trento discovers separately.
To know why a component requires your attention, you need to know which factors contribute to its health. The following sections explain the aggregated health icons, factors for each component, and the rule that combines the factors into a single health value.
Aggregated health icons in Trento Web
Every health icon in Trento Web console shows one of the following values.
| Value | Icon color | Meaning |
|---|---|---|
passing |
Green |
No action needed. |
warning |
Yellow |
Needs attention, but not urgently. |
critical |
Red |
Needs immediate attention. |
stopped/unknown |
Gray |
A contributing component is not running, or Trento cannot determine its value. For example, when the connection to SUSE Multi-Linux Manager fails. |
stale |
Any of the previous colors, with a clock overlay |
The value shown in the console is the last one received. The responsible Trento Agent has stopped reporting. For more information, see Identifying stale data. |
|
A dash |

How Trento calculates aggregated health
Trento evaluates each factor separately, then reduces the results to one aggregated value and reflects that value in the corresponding aggregated health icon in the Trento Web console. The factors are combined as follows:
- passing
-
All factors passing
- warning
-
At least one warning, all others passing
- critical
-
At least one critical, all others warning or passing
- stopped or unknown
-
At least one stopped or unknown, where applicable
Depending on the component, the aggregated health is calculated as a compound of different factors:
| Component | Contributing factors |
|---|---|
Hosts |
|
SAP HANA clusters |
SAP HANA secondary sync state, check results, health of SBD devices |
ASCS/ERS clusters |
ASCS/ERS distribution status, check results, health of SBD devices |
SAP HANA databases |
Overall status of SAP HANA instances |
SAP systems |
Overall status of SAP instances, aggregated health of the SAP HANA database |
Application instances in the dashboard |
Status of SAP instances |
Hosts in the dashboard |
Aggregated health of hosts that belong to the SAP system and its database |
Each factor is evaluated on its own, as follows:
saptunetuning status-
Contributes only when Trento discovers an SAP workload on the host.
saptuneships with SUSE Linux Enterprise Server for SAP applications and verifies that a host is configured for the workload it runs.Condition Health value saptuneis not installed, or the version is lower than 3.1warning
Version 3.1 or higher, but no solution applied
warning
Version 3.1 or higher, solution applied, tuning status compliant
passing
Version 3.1 or higher, solution applied, tuning status not compliant
critical
- Available software updates
-
Contributes only when connection data for SUSE Multi-Linux Manager is saved under the Settings menu. For more information, see [sec-integration-with-SUSE-Manager].
Condition Health value The connection fails, the host is not found, or the data cannot be retrieved
unknown
No software updates are available
passing
Updates are available, none of them security related
warning
At least one available update is security related
critical
- Check results
-
Contributes only when checks are selected to run on the target.
Condition Health value All checks passing
passing
At least one check warning, all others passing
warning
At least one check critical, all others warning or passing
critical
- SAP HANA secondary sync state
-
Applies to SAP HANA clusters only.
Condition Health value SOK, meaning the secondary site is in syncpassing
SFAIL, meaning replication has failedcritical
- ASCS/ERS distribution status
-
Applies to ASCS/ERS clusters only.
Condition Health value ASCS and ERS instances run on different hosts
passing
Both run on the same host
critical
- Health of SBD devices
-
Applies to clusters using file-based SBD fencing.
Condition Health value All devices healthy
passing
At least one device not healthy
critical
- Overall status of SAP HANA database instances / SAP instances
-
sapcontrolreports a status for each SAP HANA database instance and each SAP application instance, which Trento Web shows as a color.Condition Health value All GREEN
passing
At least one YELLOW, all others GREEN
warning
At least one RED, all others GREEN or YELLOW
critical
At least one GRAY
stopped
Aggregated health in the dashboard
The dashboard is the main page of Trento Web, and you can always return to it by clicking Dashboard in the left sidebar. It presents the health of each SAP system across the layers of the SAP architecture, and groups the systems in three health boxes:
- Passing
-
Systems whose layers all report passing.
- Warning
-
Systems with at least one layer with warning health and all remaining layers passing.
- Critical
-
Systems with at least one layer with critical health.
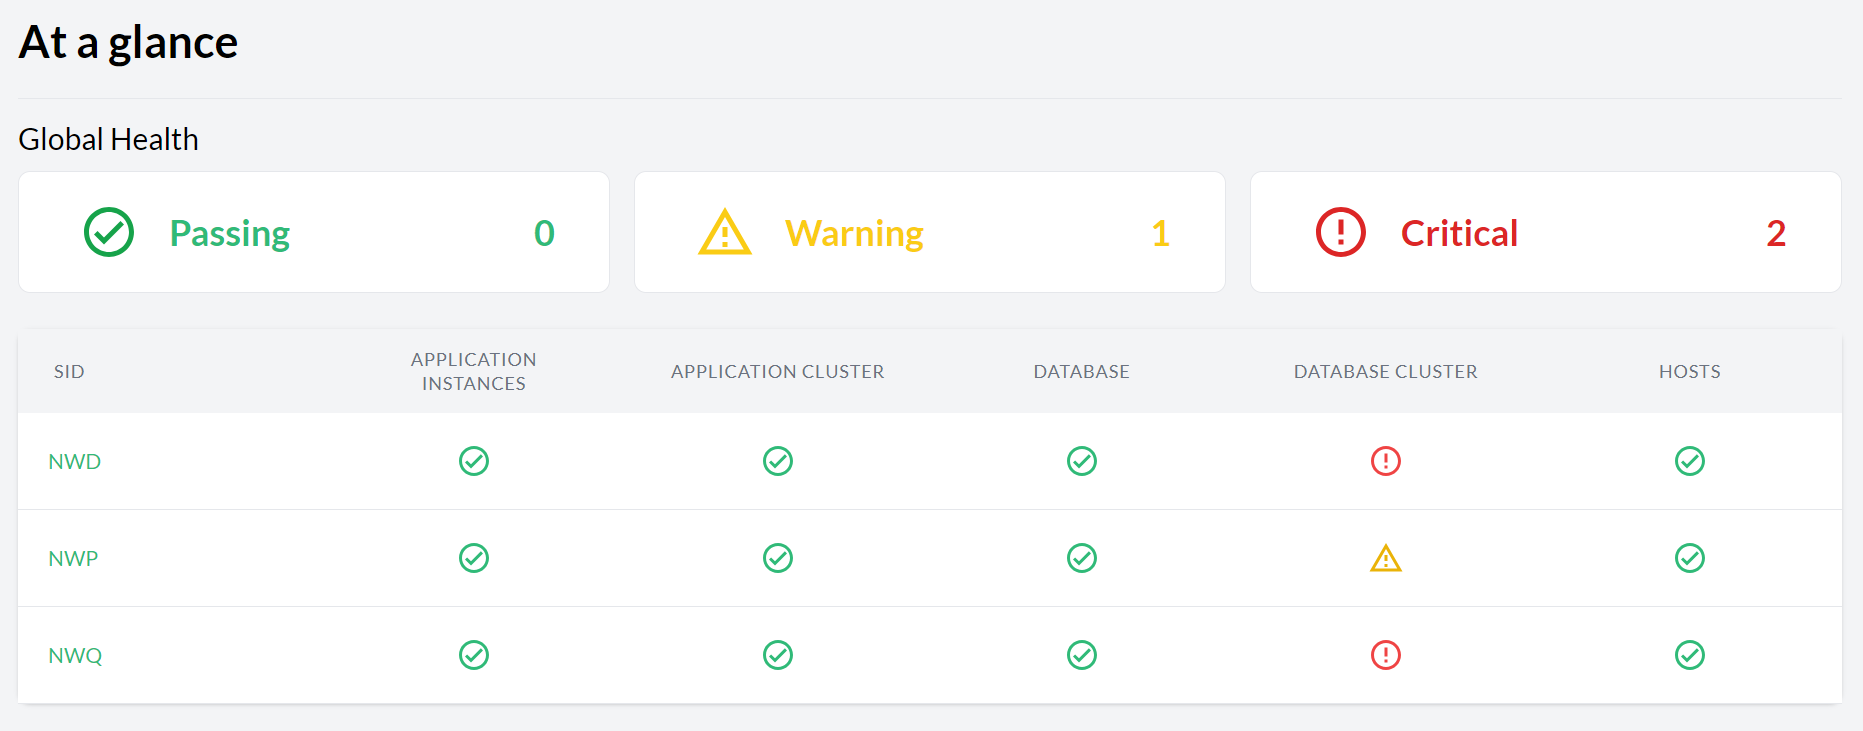
The boxes are clickable. Clicking a box filters the dashboard by systems with a layer with that aggregated health, which is the fastest way to isolate the affected systems in a large landscape.
Two dashboard columns carry aggregated values of their own:
-
The Application instances value combines the status of the individual SAP instances of the system. Database instances are not taken into consideration here.
-
The Hosts value combines the aggregated health of all hosts that belong to the system and to its database.
For more information on how the aggregated health is calculated for those columns, see How Trento calculates aggregated health.
Identifying stale data
A Trento Agent is continuously sending up-to-date data to Trento Web. When an agent stops reporting, for example due to a connectivity issue, service crash, or host crash, Trento Web keeps displaying the last data it received from that agent.
Data that is no longer refreshed is marked as stale. A stale value was correct when it was last received, but it might not reflect the current health of the component. Therefore, the stale value should be treated as unverified until the agent reports again.
Trento Web marks stale data in the following ways:
-
Stale icon. The regular health icon is shown with a clock overlay.
-
Tooltip. When you hover over a stale icon, it displays the date and time the value became stale.
-
Warning banner. The Details views of affected hosts, clusters, SAP HANA databases and SAP systems display a warning banner.
-
Grayed-out rows. In relevant views, the row of the affected host, cluster, database, system or instance is grayed out.
-
Activity log entry. Trento creates an entry with severity
debugwhen a value becomes stale.
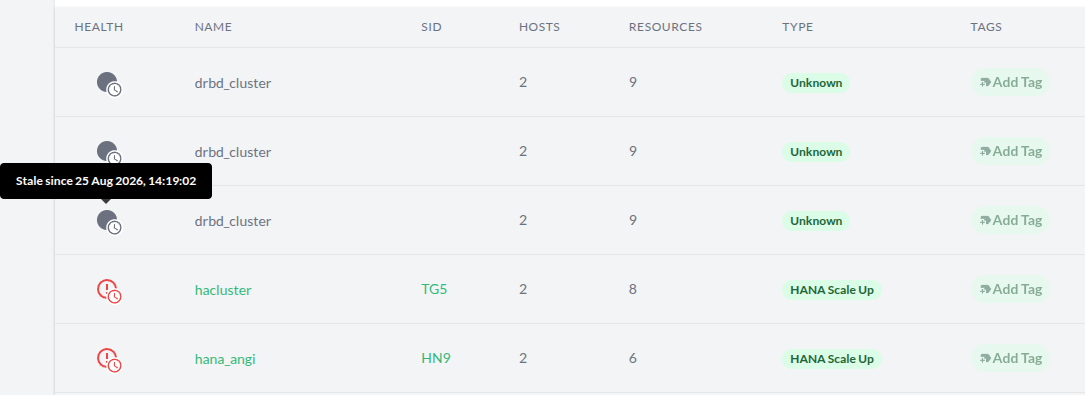

| Component | When it becomes stale | Where you see it |
|---|---|---|
Host |
The agent of the host stops reporting |
Stale icon in the relevant views, grayed-out row in the Hosts overview, warning banner in the Host Details view |
Cluster |
The agent of one of the cluster hosts stops reporting |
Stale icon in the relevant views and in the dashboard, grayed-out row in the Clusters overview, warning banner in the Cluster Details view |
SAP HANA database instance |
The agent of the host that runs the instance stops reporting |
Stale icon and grayed-out rows in the relevant views |
SAP instance |
The agent of the host that runs the instance stops reporting |
Stale icon and grayed-out rows in the relevant views |
SAP HANA database |
The status of any of its instances becomes stale |
Stale icon in the relevant views and in the dashboard, grayed-out row in the Databases overview, warning banner in the SAP HANA Database Details view |
SAP system |
The status of any of its instances becomes stale, including database instances |
Stale icon in the relevant views, grayed-out row in the SAP systems overview, warning banner in the SAP System Details view |
Application instances in the dashboard |
The status of any application instance of the SAP system becomes stale |
Stale icon in the dashboard |
Hosts in the dashboard |
The aggregated health of any host of the SAP system or of its database becomes stale |
Stale icon in the dashboard |
When you find a stale value, verify the reporting path before you investigate the component itself: check if the host is reachable and running, and whether the Trento Agent service is running on it.
Once the agent reports again, Trento Web replaces the stale value with the current one and removes the clock marker.
Finding the cause of a health issue
A non-passing aggregated health value indicates that something needs attention. To find out what, follow the aggregation from the dashboard to the factor that caused the non-passing health.
-
In the Trento Web console Dashboard, click the health box that matches the value you want to investigate, for example Critical. The dashboard now lists only the systems with a layer matching health value.
-
Identify the layer that carries the value and select the desired view. Each layer icon links to the view that holds the underlying data:
-
The application instances health icon opens the SAP System Detail view.
-
The application cluster health icon opens the ASCS/ERS Cluster Details view.
-
The database health icon opens the SAP HANA Database Details view.
-
The database cluster health icon opens the SAP HANA Cluster Details view.
-
The hosts health icon opens the Hosts overview, filtered by SID equal to the SAPSID and the DBSID of the corresponding SAP system.
-
-
Check whether a stale banner is displayed. If it is, investigate the reporting problem first. For more information, see Identifying stale data.
-
Identify the factor that caused the value and investigate, using the information in How Trento calculates aggregated health.
Configuring Trento Web settings
Users with the all:settings permission can use the Settings view of Trento Web to modify the following:
-
API key. See [sec-trento-rotating-apikeys].
-
Connection data for SUSE Multi-Linux Manager. See [sec-integration-with-SUSE-Manager].
-
Retention time for Activity Log entries. See [sec-activity-log-retention].
-
Settings required for sending alerts via email.
If any of the email settings are specified through environment variables, the web-based email configuration is disabled. For more information, see [sec-trento-enabling-email-alerts].
Troubleshooting
When monitoring your SAP landscape in the Trento Web console, you might encounter unfamiliar health icons, unexpected system values, or sudden alerts. The following frequently asked questions address common scenarios and provide immediate starting points for your investigation.
- Why is a health icon gray?
-
A gray icon means either stopped or unknown health. Stopped means the component exists but is not running, as reported by
sapcontrol. Unknown means Trento cannot determine the value, most often because the connection to SUSE Multi-Linux Manager fails, the host is not found, or the data cannot be retrieved.
- Why does a health icon show a clock?
-
The clock marks a stale value. This happens when the responsible Trento Agent stops reporting. The console shows the last known value. Hover over the icon to see exactly when the value became stale. For more information on how to investigate stale data, see Identifying stale data.
- Why does the dashboard show a dash (
—) instead of a cluster health? -
The dash means that no Pacemaker cluster manages that layer of the SAP system. The dash is not an error and requires no action.
- The health of a host or cluster is warning or critical, but all checks pass. Where does the value come from?
-
Check results are only one of the factors Trento evaluates. Investigate the other contributing factors. For more information, see Finding the cause of a health issue.
- An SAP system is critical, but all its instances are green. Why?
-
The aggregated health of the SAP HANA database contributes to the health of the SAP system. Investigate the SAP HANA Database Details view to find the root cause.
- Why is the host showing a warning for
saptune? -
This happens when Trento discovers an SAP workload on the host, and either
saptuneis not installed, the installed version is older than 3.1, or no tuning solution is applied to the host. If the host shows a critical value instead, it means the tuning status is not compliant. In this last case, runsaptune note verifyon the host for further details. - The Activity Log is becoming cluttered with old events. Can old events be cleared automatically?
-
Trento Web allows you to configure automatic retention limits to manage storage consumption and reduce clutter. For steps on how to do this, see [sec-activity-log].
- What is the fastest way to investigate email alerts, such as "Host stopped reporting" or "Cluster needs attention"?
-
These alerts are triggered by Trento’s event-driven architecture when a stale or critical value is detected. For the fastest way to investigate, see Finding the cause of a health issue.
- How are pending software updates applied for hosts shown in Trento?
-
While Trento Web shows when updates are missing and flags the health as a warning or critical, the actual patching is managed by SUSE Multi-Linux Manager. Log into your SUSE Multi-Linux Manager interface to view and apply the specific packages for that host.
- Which data should be collected before reporting an issue with Trento itself?
-
For information on which data to collect for support, see [trento-report-issue].